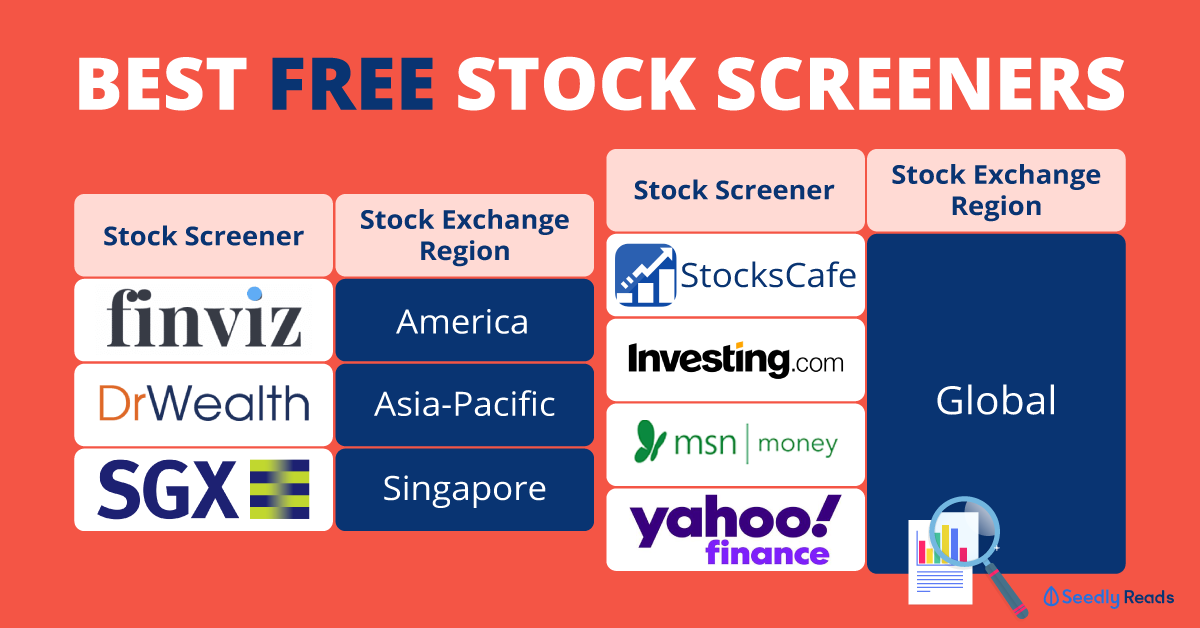
If you haven’t heard of StocksCafe, it is a platform popular amongst Singaporean retail investors that allows you to track and monitor your portfolio.
The screener covers the numerous stocks listed in Singapore, Malaysia, Hong Kong, Japan and the United States.
*Do note that you will need to create a free account to access it.
After clicking on the screener, you will be greeted with this:

Source: StocksCafe
The user interface is fairly straightforward as you can easily filter by exchange, sector and almost every metric you can think of. With this you can create a highly personalised stock screener.
There is also a really broad range of filter criteria that gives you a good mix of fundamental and technical data about the stocks.
Some of which include:
Operating cash flow count
5 year EPS growth
Altman Z-Score
Annualised historical returns (1 – 10 years)
Cash flow per share moving average convergence divergence (MACD)
Tangible book value per share
If you are intimidated by the many filter criteria, you can start off by using the shared screeners which are based on proven ways to look for stocks as well as user-contributed screeners.
But as with every investment, do your own due diligence.
After picking your stocks, you can use the analysis tools for information like price graphs, financial data, dividend history, daily price etc.
Hope this helps!


If you haven’t heard of StocksCafe, it is a platform popular amongst Singaporean retail investors that allows you to track and monitor your portfolio.
The screener covers the numerous stocks listed in Singapore, Malaysia, Hong Kong, Japan and the United States.
*Do note that you will need to create a free account to access it.
After clicking on the screener, you will be greeted with this:
Source: StocksCafe
The user interface is fairly straightforward as you can easily filter by exchange, sector and almost every metric you can think of. With this you can create a highly personalised stock screener.
There is also a really broad range of filter criteria that gives you a good mix of fundamental and technical data about the stocks.
Some of which include:
Operating cash flow count
5 year EPS growth
Altman Z-Score
Annualised historical returns (1 – 10 years)
Cash flow per share moving average convergence divergence (MACD)
Tangible book value per share
If you are intimidated by the many filter criteria, you can start off by using the shared screeners which are based on proven ways to look for stocks as well as user-contributed screeners.
But as with every investment, do your own due diligence.
After picking your stocks, you can use the analysis tools for information like price graphs, financial data, dividend history, daily price etc.
Hope this helps!