Advertisement
Is there a form of risk-adjusted return that investors can look at to compare between different P2P investments? (Something like Sharpe Ratio that kind)?
Is there a form of risk-adjusted return that investors can look at to compare between different P2P investments? (Something like Sharpe Ratio that kind)?
7
Discussion (7)
Learn how to style your text
Alex Chua
22 Nov 2019
Seedly student Ambassador 2020/21 at Seedly
Reply
Save
Hi Issac,
In my opinion, here are some statistics that you could use to compare across different borrowers:
- Current Ratio
Current Ratio measures how much Current Assets a company has relative to its Current Liabilities. It proxies as the liquidity position of a firm, and how much of its liabilities can be paid off if all current assets are liquidated.
- Quick Ratio
Quick Ratio is a more conservative ratio than Current as it does not include Inventories, assuming that a company that is failing cannot sell all of its remaining inventory to clear its debt.
- Leverage Ratio
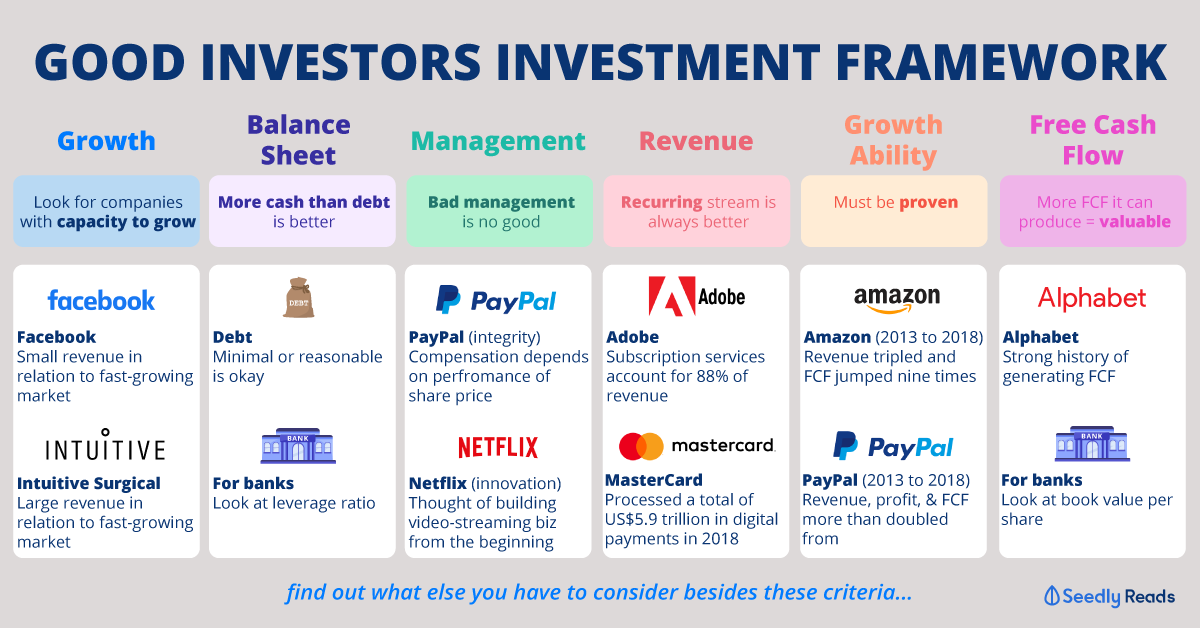
Leverage Ratio (Debt-to-Capital) measures how much debt the company is taking on, relative to the equity available in the company. The higher the ratio, the more risky the borrower is. However, this ratio should be taken with a pinch of salt because different industries have different standards for how much is the typical levered position. This should come in handy because most reports provided by the P2P platforms do highlight roughly which industry the borrower is from.
- % Fixed to Current Liabilities
Not all platforms will provide this data but it is also important to differentiate fixed liabilities from current liabilities and see how the company is performing to match its current liabilities before they can even take on their fixed liabilities. Ideally, cashflows should be able to match current liabilities minimally. To get a better gauge, you can even calculate the Cash Conversion Cycle (= Days Inventory Outstanding + Days Receivable - Days Payable) to get a sense of how long the company takes to pay off their creditors.
- Net Simple Interest Rate
Lastly, to measure how profitable investments in these companies are, we should take the rate of return into account together with the risk measures above to be able to get a comprehensive measure in totality. While I am not an experienced investor or very much knowledgeable in the realm of finance, I think we can build onto the concept of Sharpe ratio and have a rough sense of the "volatility/risk" of the investment through the use of the above ratios and then consider the returns in the numerator as per usual.
Hope this helps!
Reply
Save
Chong Ser Jing
24 Oct 2019
Former Writer/Analyst at The Motley Fool Singapore
Interesting question! Would love to hear opinions too. But if you're mentioning P2P investments in t...
Read 1 other comments with a Seedly account
You will also enjoy exclusive benefits and get access to members only features.
Sign up or login with an email here
Write your thoughts
Related Articles
Related Posts
Related Products
Funding Societies
4.1
565 Reviews
18% on interest earned
INVESTOR FEES
$20 per campaign ($100 initial deposit)
MINIMUM INVESTMENT
1.26%
DEFAULT RATE (2020)

Minterest P2P Lending
4.5
62 Reviews

BRDGE P2P Lending
4.1
251 Reviews
Related Posts
Advertisement


There is no formulated martrix for p2p investments yet. Maybe a kind soul can start to create one.
In my opinion, for platforms you can take compare:
1)annualised Rate of returns VS default rate
2) Rise of funds issued vs % of successful repayment - More loans issued = more loans Choice = more room for diversification
3) Credit scoring system (FACTSHEET)
As for individual loans, you can look at ,
1) Cash Flow
2) Leverage ratio/ cash ratio
3) Equities - Liabiliities Ratio (my personal preference) / Current ratio
4) trends of net profit/ gross profit
5) Simple interest Rate it is closely related to the platform credit scoring system. Technically, the higher the interest rate, the higher the risk.
P.S google the terminology or refer to Brian post