Advertisement
OPINIONS
Understanding Bitcoin Cycles and Price Predictions
Though volatile, analyzing Bitcoin's price history actually paints the picture of a very predictable and cyclical asset.
Thaddeus Ong
16 Jan 2021
Founder at Everything About Bitcoin
Resharing this article I shared recently on the Seedly Facebook Forum
As the price of Bitcoin continues to grow, the previous generation of crypto investors as well as a new wave of retail investors are once again beginning to take interest in Bitcoin as an investment. Unfortunately, such is the psychology and irony of investing - people who were not interested at Bitcoin when it was at 5k, are suddenly now attracted to it at 40k, a full 8x from where it was just months ago.
The most asked question now is undoubtedly - "How high can Bitcoin go this time?"
Even for investors buying Bitcoin at today's prices (upwards of 20k USD), the notion of Bitcoin reaching 100k or even 50k seems quite far fetched. How can Bitcoin _(a digital currency seemingly from created from nothing), _continue to climb year after year? However, people who doubt the likelihood of Bitcoin reaching at least 50k to 100k only feel this way because they do not yet have an understanding of the past Bitcoin cycles and phases, and more importantly, that we are only in the early-middle phase of this current Bitcoin bull market.
I believe that we have ample evidence based on previous Bitcoin cycles as well as a combination of Technical and On-Chain analyses to forecast this Bitcoin cycle top at minimally 100k to 250k, and that 50k Bitcoin at least is almost inevitable.
Using the Charts at LookIntoBitcoin
LookIntoBitcoin was undoubtedly one of the most groundbreaking resources I discovered back in 2019 that changed my perception of Bitcoin prices. Before that, I had thought that the prices of Bitcoin was "unpredictable" and that it was almost impossible to find out the the best buying and selling opportunities of Bitcoin. What I discovered was that, of course on a lower time horizon, Bitcoin's price is still extremely volatile, but on a longer time horizon, it is actually one of the most predictable assets around to invest in. With this understanding, I was able to confidently begin to dollar cost average into Bitcoin from when it was 5k, up till today.
Here I will discuss a few of the most relevant models today, to help you understand where we are in this current Bitcoin cycle (as of 29th December 2020)
1. Stock to Flow Model
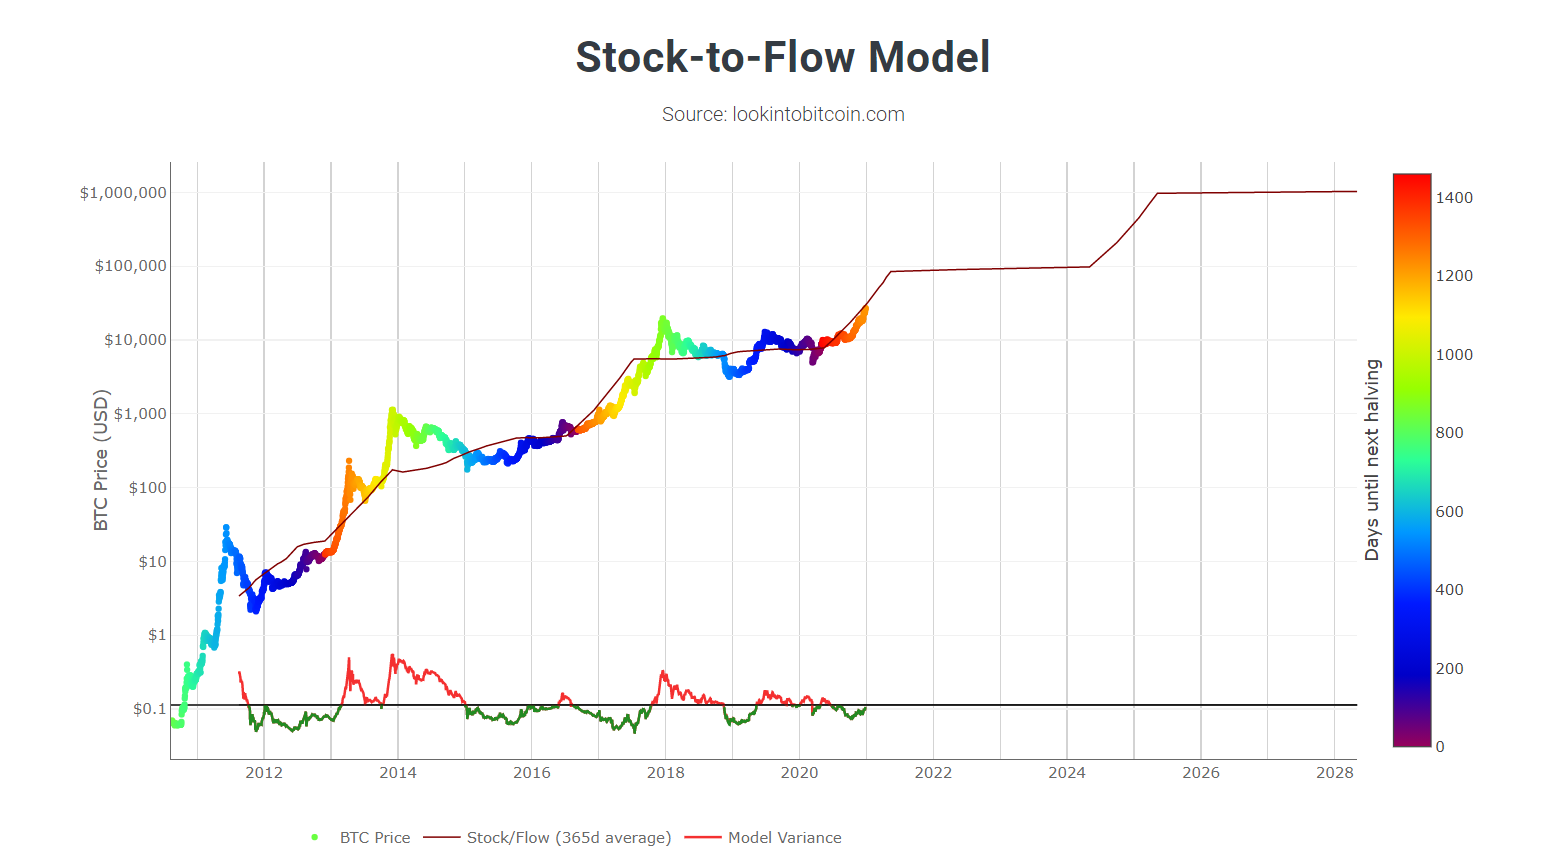
The Stock-to-Flow model is one of the leading indicators used by Bitcoin analyst today to paint a macro-perspective of where we are in today's Bitcoin cycle as compared to previous cycles (via days from the next halving). As you may know, Bitcoin halvings are predictable events that happen roughly once every four years. When it happens, the supply of new Bitcoin in the market is halved, decreasing the supply while demand remains unaffected.
Historically, looking at the coloured dots, we can see that in the last few cycles, approximately 900 days from the next halving is where Bitcoin typically peaks (light green dotted zone), followed by a lengthy correction lasting about 1 year (green towards blue zone). The cycle repeats year on year, with the start of a new bull market roughly 200 days before the next halving and the end of the correction. We are currently in the extremely bullish orange zone (1200 days to the next halving), and if the previous cycles are an accurate gauge, then we have 300-400 days left to the cycle peak (the next light green zone), and alot of room left to run in this cycle.
Click on the diagram or here to learn more about the Stock-to-Flow model
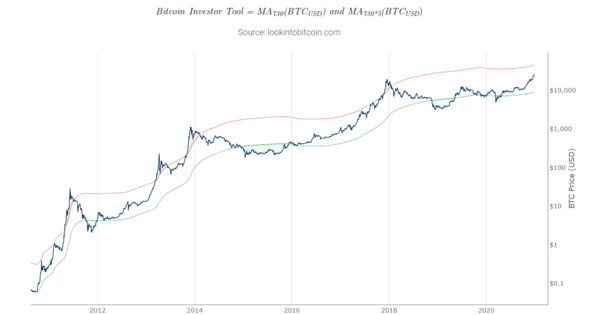
2. Bitcoin Investor Tool: 2-Year MA Multiplier

The Bitcoin 2-Year MA Multiplier is another model which is extremely easy to use and accurate on the higher time frames (long term view). Here, you can simply see the Bitcoin's price strongly respects a wide range between its 200 day moving average and the 5x multiple of the moving average. In summary, any time the price of Bitcoin dips below the moving average (green zone) is a fantastic buying opportunity and anytime it crosses above the 5x moving average (red zone) is a great time to sell. We are currently closer to the sell zone than we are to the buy zone, so it is clear that we currently are not in the optimal time to buy Bitcoin (that was back in early 2019 as well as a brief period in 2020). With that said, we still have some room left to run in this cycle.
Click on the diagram or here to learn more about the 2-Year MA Multiplier
3. 200 Week Moving Average Heatmap

The 200 Week Moving Average Heatmap is perhaps one of the most important diagrams we can look at today because it paints into perspective just how much more Bitcoin can run in this current cycle. In summary, it shows (in the coloured dots) how much Bitcoin's price has changed as compared to the previous 200 weeks. Generally, as Bitcoin has been on a long-term uptrend since its inception in early 2010's, anytime when the average Bitcoin price in the last 200 weeks has not increased by more than 4% is a fantastic buying opportunity (blue dots). On the other hand, in times when the average Bitcoin price in the last 200 weeks has increased by more than 16% in the (red dot), it typically signifies that the price of Bitcoin is overstretched and due for a large correction back to the mean 200 week price. A very simple and predictable model to understand, and also one that I would be keeping a close eye on for signs of the current bull market top (when it turns red again).
Click on the diagram or here to learn more about the 200 Week Moving Average Heatmap
Make full use of the free resources on LookIntoBitcoin and Everything About Bitcoin
Hopefully as I have shown above, the trajectory of Bitcoin prices are very predictable, and there are more often than not always clear signs and indications of market tops and bottoms. Simply by understanding them and observing them from time to time, you can make safe entries and exits from the market, so long as you adequately manage your risk and exposure.
There are countless of other charts available on LookIntoBitcoin and I highly encourage all investors to take the time in understanding the charts and where we are in relation to the past and present market cycles.
What are your thoughts about the current Bitcoin bull market, and where we are in the cycles? Share your thoughts in the comments below!
Comments
3104
0
ABOUT ME
Thaddeus Ong
16 Jan 2021
Founder at Everything About Bitcoin
Contributing on Bitcoin and Crypto investing. Started off investing in traditional markets, primarily a derivatives trader today.
3104
0
Advertisement
No comments yet.
Be the first to share your thoughts!