Advertisement

OPINIONS
Portfolio review - May 2022 (Equities)
Welcome to Goblin Town - Part Deux
Full article on Substack (including my life journey!) can be found here and here. My substack profile here. My Twitter profile here. April's Seedly opinion article (on Crypto and Equties) can be found here.
Regrettably, this newsletter about my portfolio has gotten a little long. Hence I’ll split it into 2 parts. Here is a handy table of contents (which might change from time to time) that you can navigate around to read the parts that interest you.
- Portfolio performance
Equity breakdown
Equity performance
Equity movements
Crypto performance
Net worth changes
- Commentary - Equities
Broad commentary
My portfolio movements
- Life (in Substack link above)
===
Equity Portfolio Breakdown
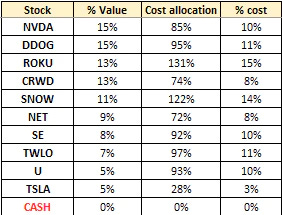
% Value: Value as % of my portfolio
% Cost: Cost as a % of my total cost invested into equities
Cost allocation: Based on my set target in USD. 100% means over-allocated…
This table simply visualises the divergence between my investment thesis and the current market expectations of the company. No hard rule on % cost allocation for stocks yet, nor a threshold where I will trim them.
Equity Portfolio Performance
I’ve recently switched brokerages, and so the cumulative returns will be a little wonky. It is clear as day though, that my portfolio was decimated in May (despite the end-of-month rally). Down, but not out. 💪🏻
Time-weighted returns (IRR) & CAGR - Past 12 months (right), New brokerage (top left), and cumulative (bottom left)
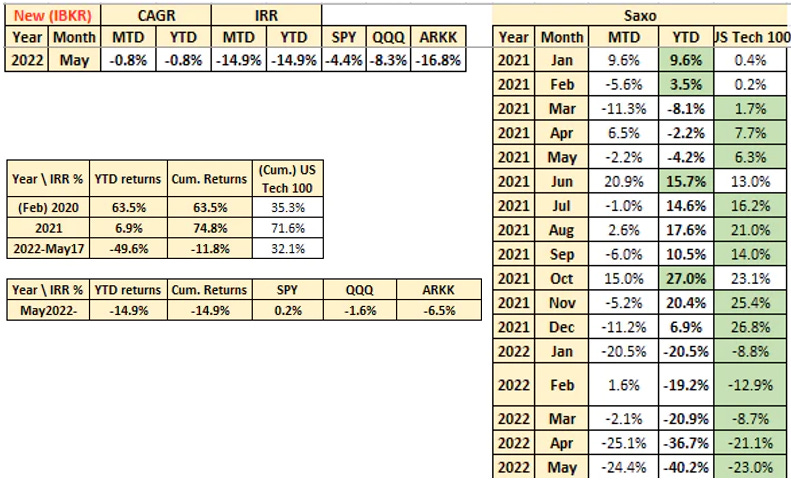
CAGR* Performance

Note: CAGR for my portfolio is calculated as (market value of portfolio including cash) as a % of cost - 1. CAGR for NASDAQ & SP500 is calculated by retrieving the month’s performance (e.g., 5%), then extrapolating it over previous month’s market value + $ injections in the current month. This is also known as money-weighted returns.
It’s a good measure for non-investment savvy folks who wants to know how much money they take out vs what they put in; Value over cost. My chart is an attempt to simulate this by using MoM returns of classic benchmarks to compound my cumulative additions into stock markets. I’m doing this bc investment calculators for NASDAQ & SP500 isn’t as accurate I would like them to be.
===
Thank you for reading my monthly journal of my portfolio. I keep it very real and authentic because nobody can buy the bottom and sell the top. Life is full of mistakes and writing this helps me identify what went wrong and how I can improve. Besides investment I also talk about my life (also a journey) as I live through it.
Catch the monthly update of my personal and investing life by subscribing here.😊
===
Equity Portfolio Changes
Added: DDOG, U, TWLO, SNOW, ROKU
Started: TSLA
Trimmed: nil
Sold: nil
===
Crypto Portfolio Performance*
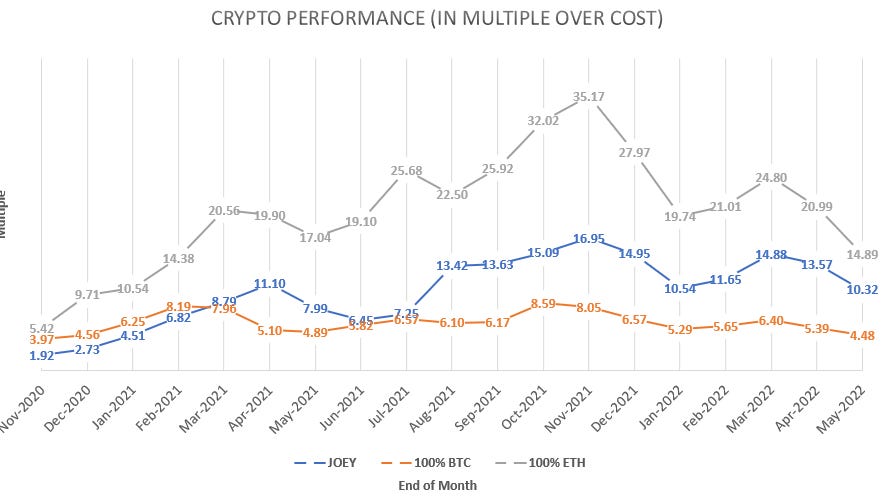
- Charts start from end of November 2020 when I started recording my crypto portfolio. Summarizing:
2020 performance: 2.7x-ed my portfolio
2021 performance: 5.5x-ed my 2020 portfolio
Lifetime performance: 10.32x my cost
Lifetime result:
- Achieved 2.30x of BTC performance (10.32/4.48)
- Achieved 0.69x of ETH performance (14.89/10.32)
Goal is to try and outperform BTC and ETH from here on out. 👍🏻
===
% of Net Worth (direction change from previous month) in:
Stocks: 15.1% (🔼🔼)
Crypto: 75.2% (🔽🔽)
Net worth excludes fixed assets (e.g. house).
===
Equities
Equities move due to buying and selling. Majority of the volume is transacted by algorithms that trade at the millisecond or even microsecond on sentiment, text or any other information that can be parsed by AI. This further brings to bear (ha) the importance of not getting the time right, but instead getting the long-term direction right. Most of us don’t want to spend more time than is necessary on the stock market, so we must be able to abstract ourselves and reflect on the entire market as a repeatable cycle of human nature.
An anecdote: I was at a gathering with some friends and new acquaintances. The inevitable stock crash came up; everybody that had US exposure resigned to fate that their portfolio value is now swimming in the depths of the Mariana trench (aka underwater).
It felt surreal, because they too struggle with the stock market, despite their high-flying careers. Buying company X that turned out to be a dud (e.g. $PLTR, $U, list goes on and on), and then consciously switching off until the stock market stages some form of rally. Attaching emotions or being affected by stock prices was something I fell prey to, during the crypto crash of 2017-18, as well as my early casual investing days (2012-2016).
It appears that there’s a general consensus in wanting to suffer together. This is something that Peter Lynch highlighted in his famous lecture (shared it in my last article). Paraphrasing, he said that it wouldn’t look good if he (the fund manager) was out golfing when the fund crashed alongside the market, even if there was nothing that he can do. The _sharing _of pain seemed to be a common theme throughout life.
This leads to a self-reinforcing loop where everybody accepts the current consensus thinking, which can be hard to make contrarian moves (e.g. buying in fear, selling in greed). How then, can average retail investors get out of this loop?
My stance (as regular readers would know) is that retail investors (perhaps even me) generally don’t understand how the stock markets work. I’m certainly no expert, and whatever I’ve learnt, I’ve shared with you for a few months now via this Substack already.
Clearly, we are in a different financial environment vs 2010-2020. Understanding how the monetary cycle works (tightening, easing) and its effect on the stock market is _super, super _important. If you’re a stock-picker, you must of course understand everything about the companies you own.
People always like to quote gurus who got in companies early, but nobody mentions the gut-wrenching 50-60-70-80 or sometimes 90% drawdown for their all time high. Survivorship bias naturally tells us that for those that made life changing money by buying $AMZN from when they’re categorized as small caps, there are those that lost it all buying $ABCD that had a 90% drawdown but never made a new ATH again.
Excluding lucky investors that forgot about their stock holdings, truly successful investors check and verify their thesis along the way. It can be hard to do so if you’re investing based on 2nd hand sources and not supplemented by your own understanding of how the company works and how it fits into the broader industry.
For me, I routinely review the earnings results and call for my portfolio companies, then summarize the findings into a 1-pager quarterly review of their performance, financials, product lines, and outlook. You can view my thoughts on my portfolio companies, as well as my highest / lowest buys here.
If you’re just trying to DCA into market indices such as $VOO (S&P 500) or even the ARK Invest ETFs, here are some words of wisdom (in my own words) that stood the test of time (have been bombarding you over the past few months):
Share prices go down, and they go up. They go up most of the time, but sometimes they go down for brief periods, but during that period, it can go down further than anybody expects. Periods are often measured in months/years.Buy when there is fear, and sell when there is greed.Negative events feel 2-3x as bad as positive events. You feel more pain during the former than you feel joy during the latter.
Sounds simple eh?
The common fallacy of “just waiting it to go back to breakeven” is as treacherous as they come. How can you make money if you don’t buy it low? Waiting to switch on again only after a substantial rally has taken place in your stock seems quite ludicrous to me, especially since you can never time the market (if you could have, you would’ve sold everything in Nov 2021). Where is the point of maximum financial opportunity?
Since shares are ownership in a busines (usually having net positive assets), it’s intuitive I guess that the value/worth of a certain asset (share) is lower if it is priced lower. Realistically speaking, if we take that to be the case, we should only buy $SE above $300 and $TSLA above $1100, and sell them 50% off of their ATHs.
Right…?
That is why investing is so hard. I too am struggling in terms of my portfolio performance, but my intuition / knowledge tells me that:
- Share prices won’t go to 0 (it really can’t, even at point of bankruptcy)
If share prices crash another 50%, it might cause stresses in the financial system which will force Fed’s hand to ease monetary conditions again. What do you think happened when monetary conditions were eased (circa Mar 2020)? - The best times to buy shares are usually when there is panic.
The timing will be even better if the entire market is panicking (& not just for your companies) - Stock market moves slower than what mainstream media reports. Rallies happen over the course of 1-3 years, and likewise recession happens over 6 months to maybe 1 or 1.5 years, every 7-10 years.
In no way is this financial advice, but generally speaking, riches are made by buying low and selling high. Sounds crazy right?
Over the short-term, price does not equal fundamentals (but _way _more correlated with sentiment). How can companies that consistently beat analyst estimates continue to go down? Another piece of the puzzle is multiple compression, but I doubt anybody here wants to learn it through the Substack written by a retail pleb who has grossly underperformed the market. If interested, read the tweets of this guy.
Have also watched a great podcast by Simon Erickson (founder of 7investing) and Puru Saxena, a long-time infamous FinTwit Furu (most famously ridiculed for selling out his growth stocks at 2/3/4x gains when others were expecting 10x).
These 2 folks are also great at their craft (happens to be growth investing as well). TL;DR of the podcast above: Need to find the FAANG of the 2020s (i.e. next 10 years). Fed won’t impose tightening monetary conditions forever, and once inflation is squashed, what happens to general market liquidity? Does it get tighter or looser?
What about the stock market?
Anyway, I’m still young (28) so I have time and money to embark on this journey of risk for future potential reward.
===
Equity Portfolio changes
I managed to transfer my stocks from Saxo into Interactive Brokers. The main motivation was to save on fees, as well as to track my portfolio performance better. It took around 3 business days, with fortunately no hiccups. I also had to incur about $230 SGD in transfer fees, for about 9 stocks, so not really sure how the costs were calculated.
Anyway, that’s hopefully the start of lesser fees, but as if that’s gonna help my portfolio. Enough rambling, will discuss my adds below.
Unity
Dumb move before the dump. Bought the stock pre-earnings (4th May, which was 6 days before it’s earnings after hours). I don’t know what it is about my flaws that I repeatedly buy stocks before the market can react to their earnings. My thoughts then about the purchase (have written brief comments to justify each buy/sell I do).
Dip below IPO price, bought some to allocate cash and low price for long-term stock with secular trend. Bought $64.45
Sure enough, market did had something to say about Unity’s earnings, which suffered a one-time revenue impairment due to one of their ML-focused products that ingested bad data. Stock price bottomed around $29, and is now $40 (20May2022). Good company, strong market position (duopoly with Epic Games). Wrong timing. 💁🏻 ♂️
Datadog, Twilio, Tesla, Snowflake
These adds weren’t made pre-earnings, but generally was done so during market drawdowns. Market caps & revenues discussed all from Jamin’s Clouded Judgement (27May2022).
Twilio has become cheap, but still growing reliably at 30% at a Last 12 Months (LTM) revenue of about 18.5b (market cap) vs 3.1b (revenue). That’s about 6x. Datadog, whilst at a lower LTM rev point, is growing a lot faster, even surprising estimates time and time again. Market cap 30b vs 1.1b revenue. That’s quite expensive, so will slowly add, hopefully in the 70s and 80s. I rate Datadog higher than Twilio, given that Datadog has already been GAAP cash flow positive for the past 8 quarters, DBNER 130% for consecutive 19 quarters (!!) and just got positive operating margins.
Tesla is a position I restarted after having sold both my stock near $1100. I felt $710 (which i reopened at) was quite a steal, but with the price now $785 (after hitting $658), let’s see the confirmation of direction before thinking about adding more. Market cap about $785b vs LTM revenue of 62.2b. Ok slightly above 12x, that’s ok. Tbh I think I’m doing this multiple calculation wrong, and I don’t really care, since I’m not going to need the money for 3-5 years, and Tesla will likely be EV leader in next 5-10 years.
Snowflake was an add immediately post-earnings where it dropped -13% the next day (I bought $116), but recovered up till -5%, just in time for rallying into the end of month. Ok all that said and done, let’s look at my wish list from April’s article. Prices as of 31May2022.
- now $187, low $155 NVDA: $175 / $150 $140
- now $758, low $623 TSLA: $900 (200DMA) / $750 (local low) $550
- now $128, low $112 SNOW: $155 / $140 (10-20% lower) $120 (IPO $)
- now $160, low $130 CRWD: $175 / $160 (local low) $120
- now $83, low $55 SE: $75 / $65 (my first buys in Q2 2020) $50
- now $95, low $76 ROKU: $85 / $75 (near Covid lows @ $56) $65
- now $56, low $50 NET: $75 / $65 $45
- now $34, low $28 TDOC*: $50 (Covid low) / $45
- now $105, low $88 TWLO: $110 / $100 $90
- now $95, low $82 DDOG: $100 / $90 $80
- now $4, low $29 U: $65 (IPO price) / $55 $30
*Exited position in TDOC.
Sliced through my wish list like butter. Oh, we’re definitely in goblin town now. Updating my new wish list (in bold italics so let’s hope that I have the balls (and the cash) to actually act on it).
===
Life: Please visit my substack here.
===
Conclusion
Thank you for reading thus far; I hope you learn something from the things I write (be it about the markets or about me). Feel free to drop any comments or suggestions on how I should make my articles better! I fully acknowledge that the lengthiness of this article is quite a big problem, and making things concise will be something I hope to master in months to come.
Talk to you next month.
Cheers,
Joey
Comments
154
0
ABOUT ME
Crypto and Growth stocks investing with focus on thematic trends Aim: Achieved outsized returns over the long term.
154
0
Advertisement
No comments yet.
Be the first to share your thoughts!