Advertisement

OPINIONS
Are you using the P/E multiple correctly?
Despite its popularity, it remains the most misunderstood metric. Find out why a 30x P/E may be cheaper than 15x P/E!
Thomas Chua (SteadyCompounding.com)
28 Oct 2020
Writer at SteadyCompounding.com
The price-earnings (P/E) multiple is one of the most popular tools which analysts use to value stocks. A company trading at 10x P/E implies that for every $1 in net income generated, investors are willing to pay $10 or a 10% earnings yield.
Despite its popularity, it remains one of the most misused misunderstood metric. A share valued at 30x P/E might not be expensive relative to another stock trading at 15x PE. Likewise, a share trading at lower P/E today, when compared to its 10-year median P/E, does not imply that it is a bargain.
To apply this tool, we must first deconstruct the P/E ratio to better understand what goes in. The P/E ratio is a short-cut to arrive at the Discount Cash Flow valuation. The most sensible way to determine the worth of a business is to estimate the cash flows a business will generate for its owners over time, and then discount these cash flows back to their present value.
Hence, to figure out the intrinsic value we need to ask ourselves these questions:
How much free cash flow (FCF) will the business generate over its lifetime for shareholders?
Can the business grow?
What is the discount rate (i.e. required rate of return/cost of capital)?
In this post, we are going to focus on the relationship between – (1) the amount of cash flow the business generates and (2) its ability to grow this future stream of cash flow.
This brings us to the next question, Why is the cash flow available to shareholders different across companies? Two companies with the same amount of revenue and net income may well generate different levels of cash flow for shareholders.
This is because different companies require different amounts of reinvestment in their business for growth. The more a company needs to reinvest to achieve growth, the less the company retains for shareholders. And this variation is largely driven by the differences in the return on invested capital (ROIC) achieved.
ROIC’s impact on FCF & Growth
Consider two companies, Company A and Company B both generate $1 of earnings per share. Both companies aim to grow their earnings by 10% next year. It would require the companies to reinvest their earnings for expansion.
The key is understanding how much capital is required for each company to achieve a growth of 10% in earnings?
Suppose Company A is able to generate 60% ROIC (similar to a business like Mastercard). This means that every $1 invested in the business, results in a 60% growth in earnings. For it to grow its earnings by 10%, Company A would only need to reinvest 16.7% of this year’s profit. Since a 60% return on 16.7% of current earnings will create a 10% increase in profit. This means that Company A is able to distribute 83.3% of the current year’s earnings, or 83.3 cents of the $1 in earnings back to shareholders, through dividends, share buybacks, or by reducing its debt.
On the other hand, Company B is only able to generate 12% ROIC (similar to the S&P 500’s average). To grow its earnings by 10%, it would need to reinvest 83.3% of its earnings. Since a 12% return on 83.3% of current earnings will create 10% more profit. This leaves only 16.7 cents of the $1 in earnings for Company B’s shareholders.
Here we can see that Company A’s ROIC is 5 times greater than Company B’s. To achieve the same growth of 10%, Company B needs to reinvest 5 times its earnings compared to Company A.
Essentially, this shows us that not every dollar of earnings is worth the same amount. Although both companies have the same earnings per share of $1 and generate 10% growth, they require different reinvestment rates. Thus, it boils down to the ROIC that a company is able to generate.
All else constant, a company with a higher ROIC should command a higher P/E multiple and vice versa. A company trading at 30x P/E and another company trading at 12x P/E could both be fair value.
We need to dig deeper into its ROIC and evaluate its sustainability.
Why growth may destroy value
Not all growth is good for shareholders. For growth to generate value for shareholders, its ROIC must be greater than its cost of capital.
The S&P 500 index has returned an average of approximately 10% since inception. Hence, we can consider using 10% as the cost of capital. When deciding whether or not to grow, management should evaluate whether the ROIC from reinvesting earnings could exceed 10%.
If ROIC is 8%, reinvesting for growth would reduce value for investors. Companies should choose to distribute out all its earnings to shareholders as the returns from reinvesting earnings fails to exceed the cost of capital of 10%.
The best way to think about this is to imagine a company borrowing at a 10% interest rate and investing for 8% returns. Every dollar borrowed to invest for growth would result in a -2% returns for shareholders. While the cost of equity capital isn’t an interest expense, it is an opportunity cost for investors.
It is important to be aware of this. Even if companies have the same earnings per share and the same growth rate does not mean that they are worth the same P/E multiple. Because ROIC makes a huge difference to whether growth adds value, or destroys value.
How to think about the P/E ratio
In assessing the worth of a company using the P/E ratio, we must first consider whether the company is able to generate ROIC in excess of the cost of capital and growth second. Growth only creates value if the investments generate a return in excess of the cost of capital.
For example, here is a quick and dirty way to evaluate Apple’s P/E ratio:
 Apple’s Stock Price Chart
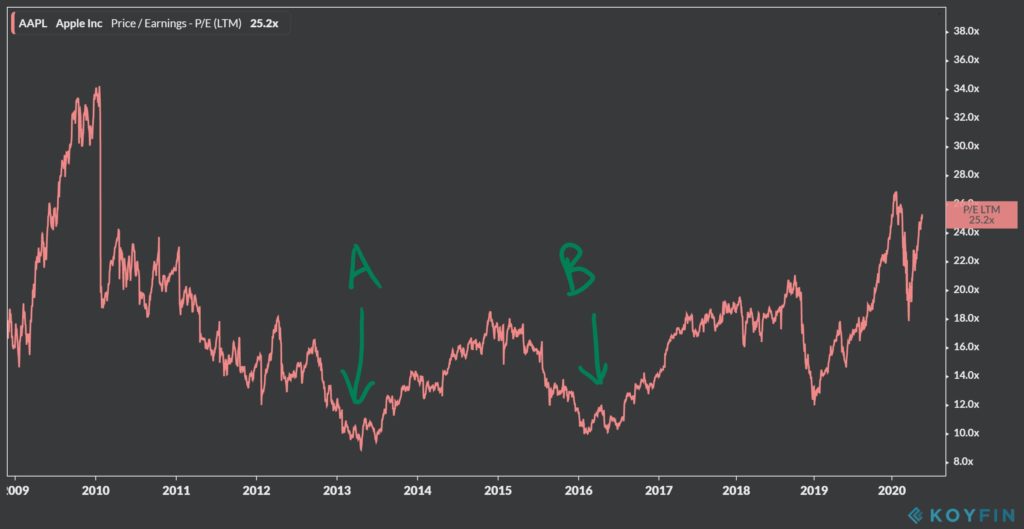
It has traded at P/E of below 10x two times over the past decade (points A and B). This is way below Apple’s average P/E ratio. Mr Market was essentially saying that Apple is unable to maintain its ROIC and was unlikely to grow further.
When compared with the broad market’s valuation (S&P 500). Apple was also below the market’s valuation P/E ratio of 17x during point A and 21x during point B. Mr Market was telling us that Apple’s ROIC and growth will be lower compared to the average American company.
Investors should then evaluate if the current P/E underestimates Apple’s ROIC and growth going forward.
In hindsight, Apple continued to generate a high ROIC of approximately 30% and grew its EPS at a CAGR of 11.13%. A rate far above the S&P 500’s ROIC of 12% but lower than Apple’s historical average ROIC of 40%. Apple should rightfully have suffered a P/E contraction. But Mr. Market over discounted Apple with its P/E collapsing below the average S&P 500 companies’ P/E multiple.
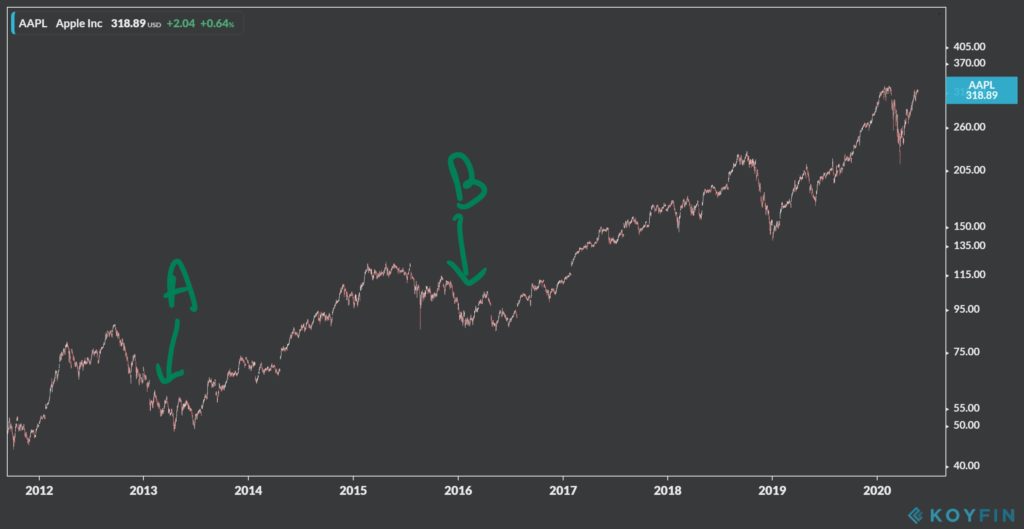
Mr. Market eventually corrected Apple’s P/E multiple. Investors who have been right on evaluating its ROIC and growth, and bought Apple when it was trading at a P/E multiple of ~10x would generate handsome returns of approximately 600% in 7 years and more than 300% in 4 years if they bought in at points A and B respectively.
 Apple’s Stock Price Chart
For more information on understanding P/E ratios, readers may check out the white papers published by Epoch Investment Partners and Michael Mauboussin.
Thank you for taking the time to read my article.
I publish weekly on SteadyCompounding.com
3-Bullet Sunday** **is a free, weekly email, that hones your mind and keeps you growing. It is full of timeless ideas on life and finance.
Subscribe today to get weekly insights and receive a free investment checklist!
Comments
1047
3
ABOUT ME
Thomas Chua (SteadyCompounding.com)
28 Oct 2020
Writer at SteadyCompounding.com
I write about timeless concepts in investing and life. Find me at SteadyCompounding.com
1047
3
Advertisement
No comments yet.
Be the first to share your thoughts!